Using Analytics
What is the Analytics Section for?
Data analytics is required to visualize large amounts of work data in Smarty CRM and display the performance of the company.
You can:
- control the work of the sales department (the Contacts group);
- monitor the work of the production department (the Projects group);
- receive data on the effectiveness of chat bots (the Chatbots group).
Case One
You need to find out how many projects have been closed to evaluate an employee's performance.
To do this:
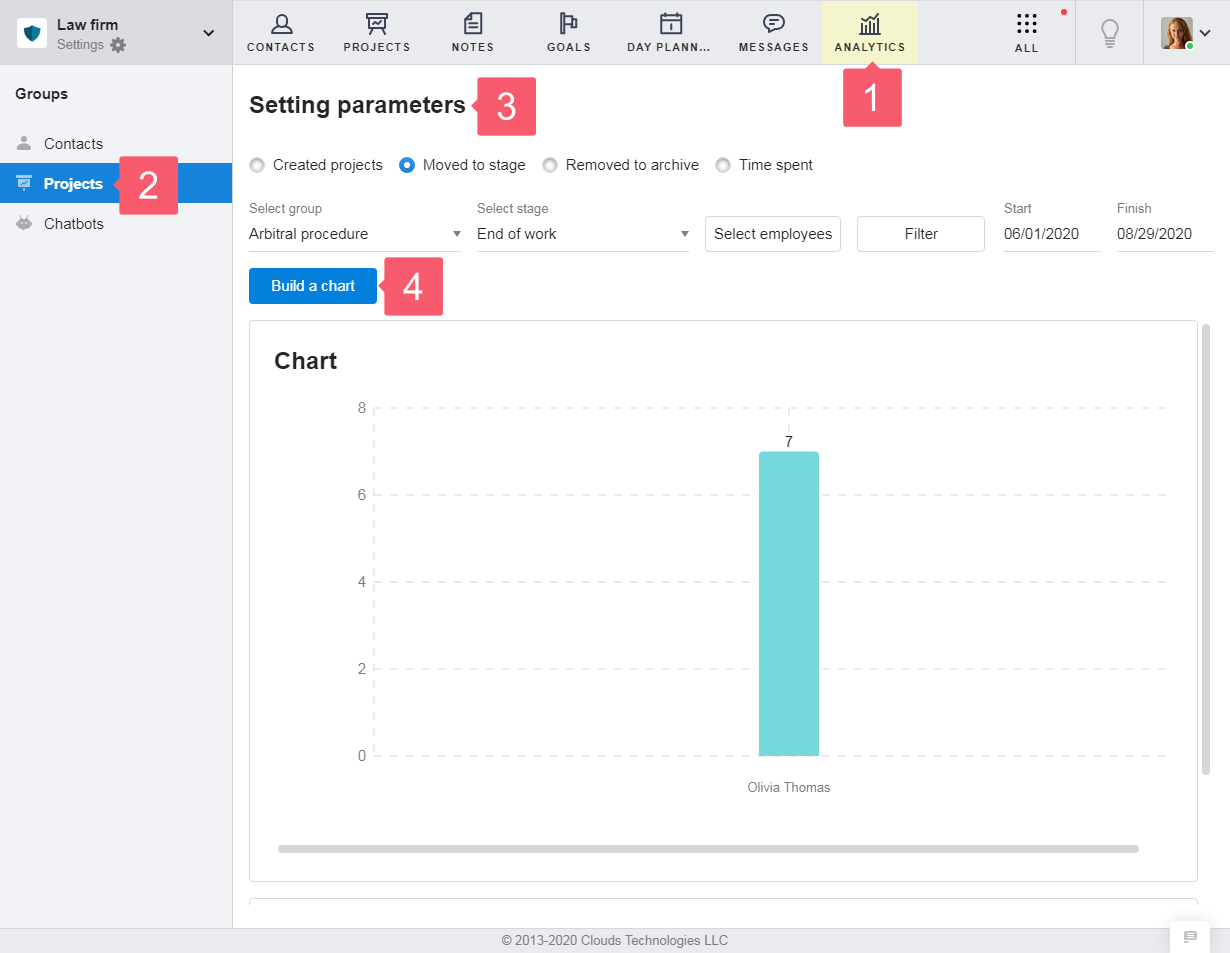
- in the Analytics section, select the Projects group;
- in the Setting parameters area select the Moved to stage analytics option ;
- in the settings for this analytics option, select:
- the Group that will be used for building objects;
- the Stage where the object is transferred to and will be tracked;
- the Employee you are interested in;
- the Start and Finish period for which the analytics will be built.
- configure the Filter parameters, if necessary. You can choose from:
- filtering by importance;
- filtering by tags;
- filtering by region.
- start the chart creation process by clicking Build chart.
The chart may not be built immediately. The build time depends on the number of objects that you have to check in your workspace during the data collection process for analytics.
After you complete the analysis, you will be provided with a chart containing information about the number of projects that the selected employee has transferred to the desired stage.
Additional information will be displayed below the chart, including:
- the number of objects that participated in the construction of analytics;
- number of employees for which the construction was performed;
- the number of days for which information about objects was collected.
Case Two
You need to find out how many contacts have been added to evaluate an employee's performance.
To do this:
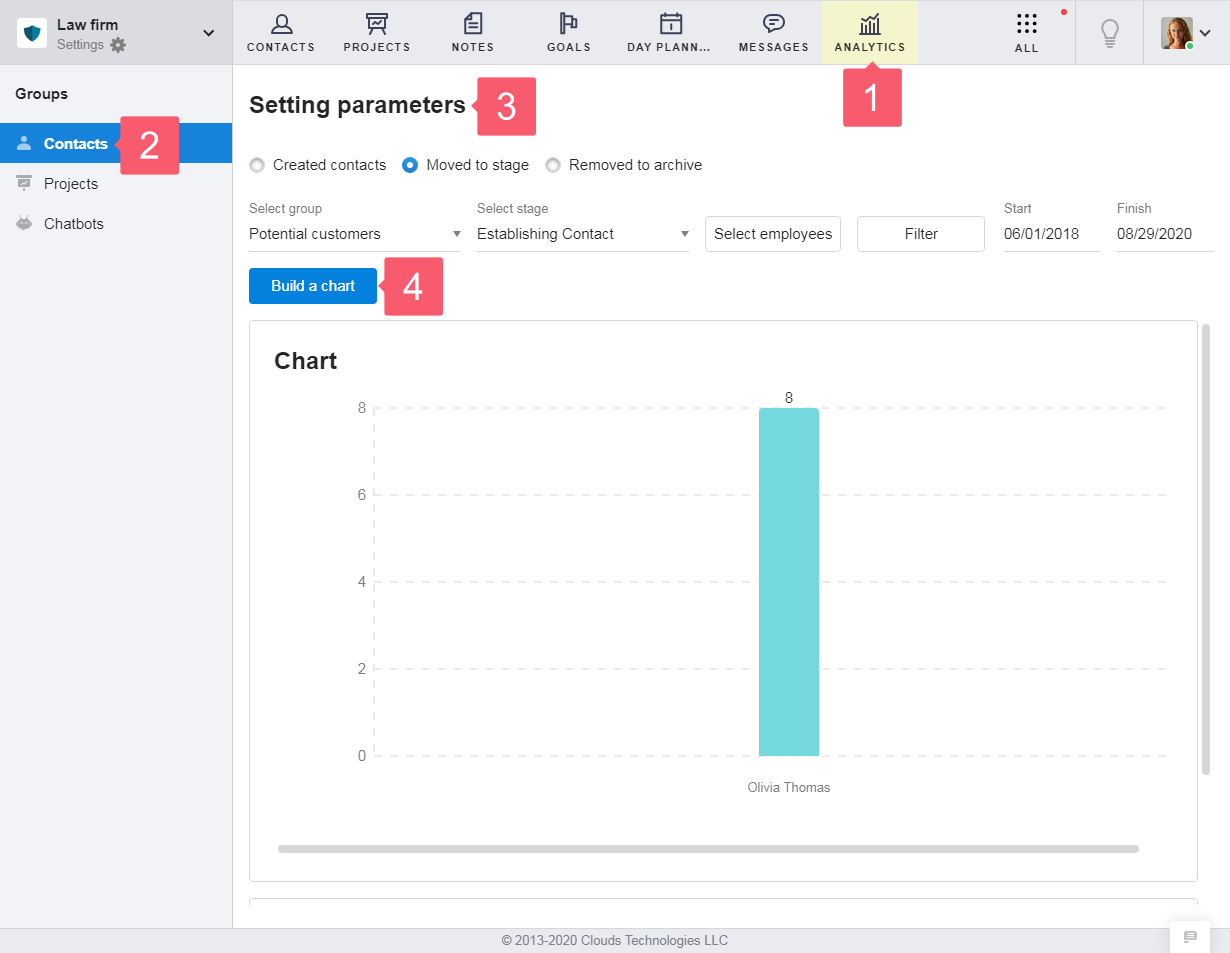
- in the Analytics section, select the Contacts group;
- in the Setting parameters area, select the Created contacts analytics option;
- in the settings for this analytics option, select:
- the Group that will be used for building objects;
- the Employee you are interested in;
- the Start and Finish period for which the analytics will be built.
- configure the Filter parameters, if necessary. You can choose from:
- filtering by contact type;
- filtering by importance;
- filtering by tags;
- filtering by region.
- start the chart creation process by clicking Build chart.
The chart may not be built immediately. The build time depends on the number of objects that you have to check in your workspace during the data collection process for analytics.
After you finish building analytics, you will be provided with a chart containing information about the number of contacts created by the selected employee.
Additional information will be displayed below the chart, including:
- the number of objects that participated in the construction of analytics;
- number of employees for which the construction was performed;
- the number of days for which information about objects was collected.
Case Three
You need to find out how the number of a bot subscribers has changed to evaluate the bot’s performance.
To do this:
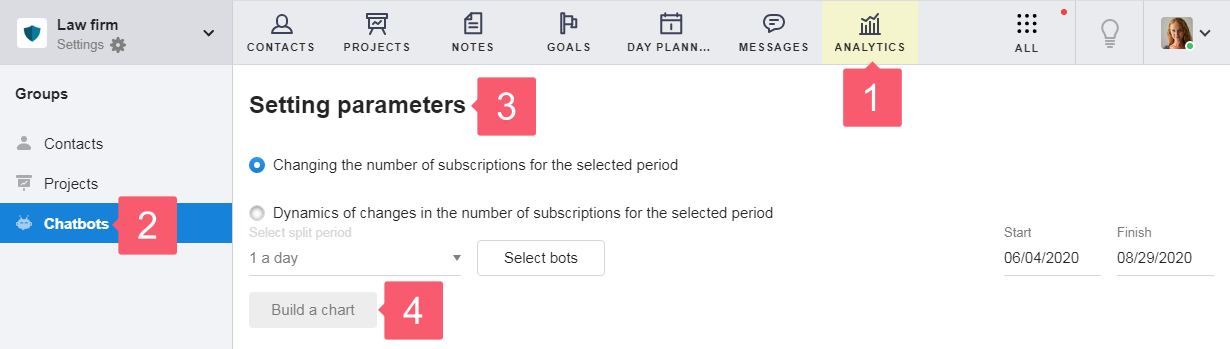
- in the Analytics section, select the Chatbots group;
- in the Setting parameters area, select Dynamics of changes in the number of subscriptions for the selected period.
- in the settings for this analytics option, select:
- the split period, according to which control points will be indicated on the chart;
- the bot that interests you in terms of changing the number of subscribers;
- the Start and Finish period for which the analytics will be built.
- start the chart creation process by clicking Build chart.
The graph may not be built immediately. The build time depends on the duration of the bot's life, the number of subscriptions and unsubscriptions from the bot, and the selected time period for building analytics.
After you complete building analytics, you will be provided with a graph containing information about changes in the number of subscribers over time.
Additional information will be displayed below the chart, including:
- number of chatbots to build a chart;
- the number of subscribers in the selected bots.